Professor demonstrates the power of Tonga's volcanic eruption
Mathew Barlow's animation shows shockwave traveling across the globe

On Jan. 15, a tiny, uninhabited volcanic island in the South Pacific called Hunga Tonga-Hunga Ha’apai erupted in an extremely violent explosion.
The event, described as one of the most powerful volcanic eruptions in the 21st century, unleashed 500 times more energy than the atomic bomb dropped on Hiroshima, Japan, in 1945. It generated tsunamis across the Pacific Basin as well as an atmospheric shockwave that traveled across the globe at more than 650 miles per hour.
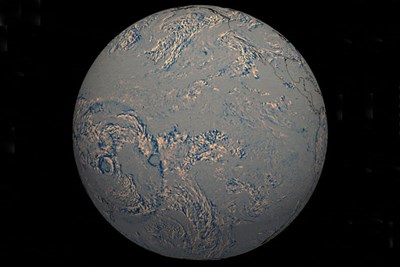
Prof. Mathew Barlow of the Department of Environmental, Earth and Atmospheric Sciences used infrared data from NOAA’s GOES-West satellite to create an animation that demonstrated the intensity of the blast. It showed the shockwave spreading outward in all directions, like a ripple formed by dropping a stone on a pond. Barlow’s animation was used in a recent Reuters story and was picked up by news outlets around the world.

“I was surprised that the wave showed up that clearly in the satellite images,” says Barlow, who is an expert in climate modeling. “This is the first time I made an animation of a geologic event. I make animations of satellite data every now and then, but primarily for storms.”
GOES-West normally takes high-resolution images of Earth from visible light to near-infrared, but Barlow was able to use the data to detect differences in atmospheric pressure.
“The satellite radiances are responding to changes in temperature and, possibly, small changes to cloudiness that are going along with the changes in pressure,” Barlow says.
While previous animations showed tsunamis generated during the 2004 Indian Ocean and 2011 Pacific Ocean earthquakes, Barlow’s animation provides a useful tool for helping people visualize an atmospheric phenomenon.
“My Tonga animation is not exactly a new use of the satellite data, but I think the event has really drawn attention to the possibilities in the data,” Barlow notes. “The high-resolution satellite data doesn’t go back very far, so we’re really limited in terms of past events, but we'll certainly be keeping an eye on future events.”
According to Barlow, there were enough surface pressure readings from the Krakatau eruption to get some sense of the atmospheric response in that case. The Krakatau volcano on Indonesia’s Sunda Strait exploded in 1883, and is considered to be one of the deadliest and most destructive volcanic events in recorded history.
“I think we’ll probably try to compare the Tonga and Krakatau events,” he says.